 PRODUCT
SUPPLY
FINAL PRODUCT
It is necessary for a good planning of the dynamic of the supply to
have an actual impression of this supply, in peticulary the timelap in
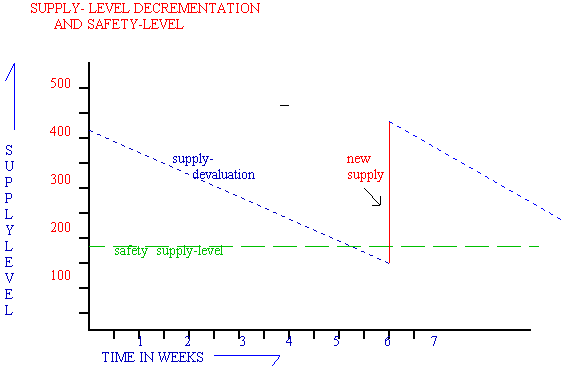
which this supplylevel goes down. This kind of countdown can be presented
in a graphic model. This model shows a period where the supplylevel goes
down by selling this supply, corresponding with the slanting
line (- - - - -),till the moment a new orderamount
comes in. This moment is actual when there is a
vertical
line in this graphic model. The length of this vertical line is
equal to the incoming amount of goods. Also there is a safety level integrated
in the model, showed by a horizontal green line,
and ment for service to the customers. It is quite simple to fill in your
own graphic level of your own supply countdown in such a x-y coordination.
