| Y = wanted supplylevel included the service degree for deliveringsgaruantee |
| X = usual amount of goods for sale (for example 1000ex in one month) |
| a = 0,05 (fixed value, does not change in any calculation with this kind of formulae) |
| b = 22,7 (also fixed value) *=multiply |
formulae: Y = a * X + b
In a sales pattern of for instance 3000ex in 1 month (X) is the calculation
for the desired supply-level (Y) as follow: Y = 0,05 * 3000 + 22,7 result
Y = 172,7. By a change of the amounts the values
a
and b are fixed, so they don't change. This
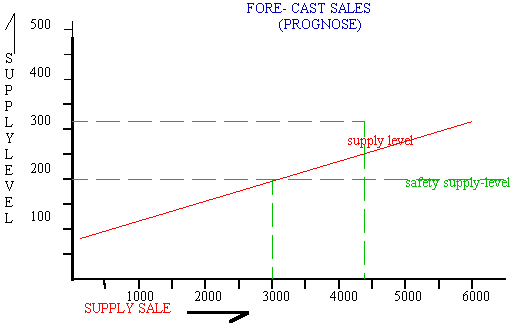
formulae can be presented in the next graphic model.
These values are giving an ideal curve, wanted by every manager, but still developed in an industrial environment and based on practice. This model is a so called linear graphic, where the straight red line don't shows any exception in sales pattern, corresponding with the daily turnover. This is why this kind of models are giving a global impression about the situation. With a sale of 3000 ex. gives the value on the vertical Y-ax a result of 173 in the safety-supply level. By sale of 4300ex. is this value 0,05 *4300 + 22,7 = 237,7 = 238 ex. safety-supply.
For the impression of ORDERPRIORITY for every article in the stock there is a method for sequential listing by deviding actual supply-level / orderlevel , for instance:a supply-level, include the goods on the way in the processes on the workfloor, of 245ex. and an orderlevel of 350ex (restricted orderamount for this product) gives a PRIORITYNUMBER of 0,7 on a scale of 0 - important (high priority) till 1 = less important (low priority). This estimation is just the opposite of the rendementsnumber, as treated in the paragraph production.
The calculated degrees of service is ment to reduce the number of non-sales. Normalization of this factor is most of the time standard 96,5% , so in 96.5 cases of the 100 questions there is a yes-sales. The service degree is in this way an important factor for the calculation of the stock level, which means on his way an invested capital in property. This is the reason why it is not by definition a good decision to handle a high degrees of service, but must be in balance with factors like capital, space and service.